

Once your website design or redesign goes live, you just sit back and enjoy the results, right? While that’s part of it, you also have to keep tabs on how the site’s performing.
A great tool that you should be using to determine how your site is performing is Google Analytics. Every website owner should take advantage of Google Analytics as it provides a lot of valuable information in terms of improving your website.
Related Content: How to add a new user in Google Analytics
The large amount of available data is what intimidates a lots of people. So we’ve come up with the 7 simple key statistics to watch and where to find them in Google Analytics. They are essential for judging performance, digital marketing efforts and your target audience. It’s a great place to begin if you’ve never used it before. You’ve probably heard of lots of these terms before but what do they actually tell you?

1. Who’s visiting your site?
You’re getting lots of traffic which is great, but do you know who’s actually visiting your website? You can check out everything from demographics and location to behaviour and interests by under Audience.
Build a profile of people who use your website, including:
- Age
- Gender
- Location
- Lifestyles
- Which pages are the most popular
- Types of content they consume online
- What types of device they use to access your website
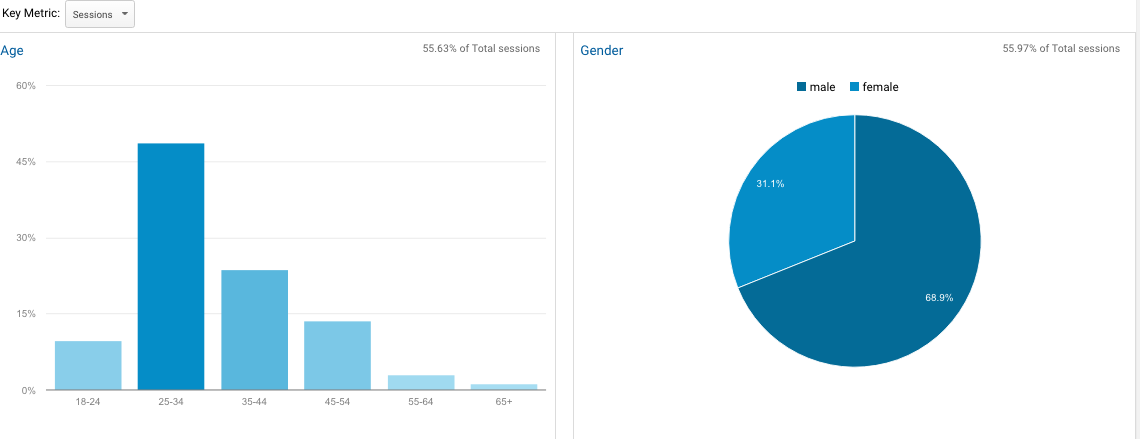
To find the Demographic data on people who have visited your site, click on Audience → Demographics and click on Overview. In this report, you see an overview of the age and gender of your website visitors.
You can look further into age segments by clicking on the age tab. In this report, you can see the number of visitors by age group and see the days each group visited. You can also see what percentage of the whole audience they comprise.
Why does this matter?
Use these stats to understand your customer better and improve website usability by tracking visitor patterns. Once you have customer profiles, you can use this information to make better decisions about your product, customer service and marketing.
If you’re getting lots of pageviews but no interest/enquiries it might indicate your website isn’t catering for the right target audience. It’s time to rethink your target audience, your marketing strategy or your website design. Have a look, does your demographic meet your ideal target audience?
2. Where are your visitors coming from?
How are visitors finding your website? Find out by going to Acquisition → Overview
Top Channels tell you where the visitor originated from before landing on your website. From paid campaigns to organic web search. Click into each source to get a breakdown, for example, which social media channel gains the most traffic to the website.
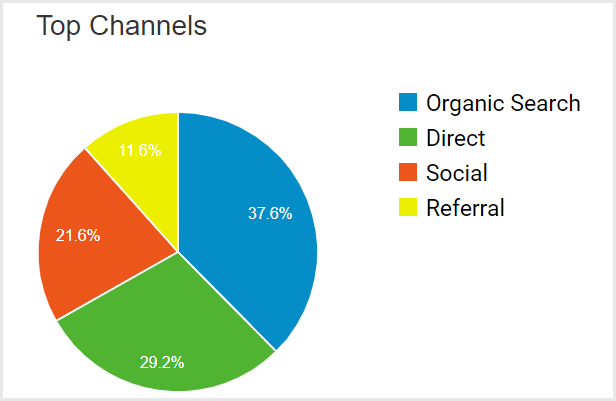
What does this tell us?
Knowing where your visitors originate from is as important as understanding who they are. This can give you clues to how your campaigns are succeeding as well as your website as a whole. If you notice few are arriving from search engines (Organic), then you know that your digital marketing and SEO needs improvement.
You can even see referrals to see how well your site is being marketed by others. It will allow you to determine whether your inbound marketing techniques like social media or email marketing are effective and where your time is better invested.
3. How long do users spend on your site?
Track both Bounce Rate and Average Session Duration to see how long your visitors spend on your site and how quickly they leave. This can all be found on the Home page or under Audience → Overview.

You’ve probably heard the term “bounce rate” before, but why does it matter?
A bounce is when someone exits your site after visiting just one page. High bounce rates indicate that your content does not interest your visitors, that the user experience is poor and/or loading times are too slow. Looking at where people bounce gives you an opportunity to improve your website and engage with your visitors.
According to Search Engine Journal, you’re probably fine if the rate is between 26% and 40%. The amount of time users spend on your website has similar indications. The less time they are spending on your website, the less likely it is that they are interested in what you have to say.
4. How do visitors interact with your site?
Where are people going on your site? Are they interacting with your call-to-actions? Are you seeing lots of traffic but no conversions? To understand your customers journey, go to Behaviour → User flow and see if your website is providing a clear pathway through your content.
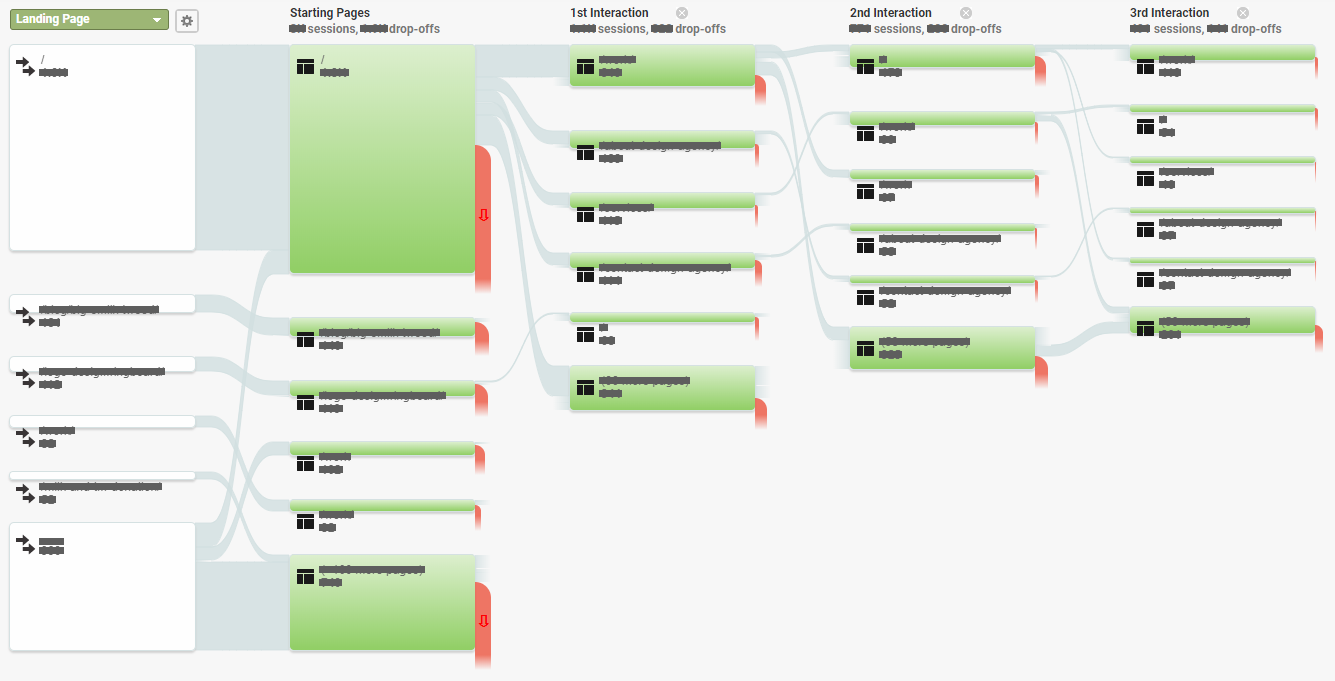
This statistic is important in understanding how you tell your ‘story’ and whether you need to make changes. It’s particularly useful when planning a website redesign. Seeing how visitors naturally interact with your site will give you insight into how to prioritise elements. If lots of people are coming from blog posts, for example, it’s probably a good idea to continue investing in your content marketing.
5. How are your landing pages performing?
The Landing Pages statistic is found under Behaviour → Site Content. Discover where visitors originate from, how long they spend on the page, how they interact with it, the conversion rate and more.
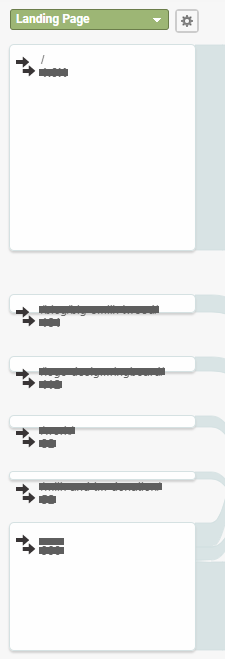
A landing page is the first page of your website that a visitor will see. For most companies, it’s the homepage; though some will have specific pages that they want audiences to look at first (e.g. a squeeze page where visitors subscribe to your mailing list).
If you’re running a campaign with a landing page, tracking how visitors interact with the page can help you determine the success of your campaign. If your website is not converting, these statistics help you determine where you might improve; including alternative marketing tactics or revised website layouts.
6. When do you have the most (and least) visitors?
Look at Source/Medium under All Traffic and base reports on Day of Week and Hour to see visitor trends for your site.
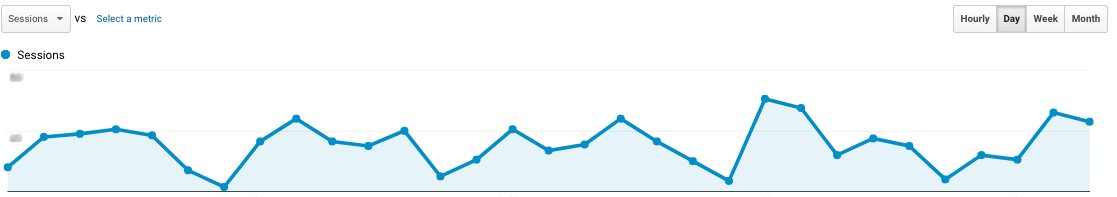
When are visitors most likely to visit your website? Weekdays or weekends? What are the optimum times? Of course, Google Analytics is able to give you a detailed analysis.
Why should you track this statistic?
Knowing the peak hours and days helps you better understand your target audience’s behaviour. It also gives you an idea of when the best times to post on social media, to upload new content and when the optimal time to perform site maintenance might be.
7. What devices are your audience using?
To see which devices, go to Audience → Mobile → Overview. Then this will give you a breakdown of the devices your audience prefers.
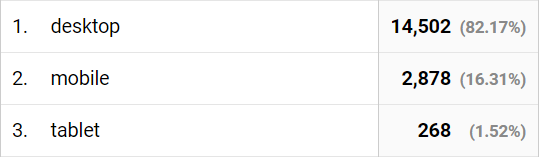
In today’s mobile world, knowing what device your visitors are using is critical. If you have a high proportion of visitors on a mobile, but your website isn’t optimised for mobile, then your conversion rate will suffer. Visitors will simply find an alternative website that has a better user experience.
Related Content: The Importance of Brand Identity and Website Design
Start Using Google Analytics Today
If you haven’t got Google Analytics set up yet, you really need to, with all this information available for free, why wouldn’t you take advantage of it? Google Analytics can help you identify shortfalls in your website, understand and what’s working well and continually improve your website’s performance.